
During my SMX Next session, I explored audience saturation to help you avoid that trap.
Here’s what I covered then and an overview of what you’ll find below:
- What is audience saturation?
- How to monitor audience saturation.
- Five solutions to overcome audience saturation.
- Real-life case studies.
What is audience saturation?
Audience saturation, at its core, is about performance.
It’s the point at which your target audience has been exposed to your content so extensively that it (your content) no longer has a positive impact.
This can lead to reduced effectiveness – or even PPC ads backfiring.
Simply put: you do not want to reach audience saturation. When you do, it translates into the following.
Lower ROI and conversion rates
When your target audience has been exposed to your content several times, they may visit your website but find nothing new.
As a result, they stop converting (e.g., filling out a lead form to download gated content).
Falling CTR and higher CPCs
Serving the same ad to the same audience repeatedly leads to lower click-through rates as users either already clicked or lost interest.
Ad networks respond by increasing your CPCs due to a lower Ad Rank.
Stagnant or declining net new reach
While the above KPIs can be caused by various factors, stagnant or declining net new reach is strongly linked to audience saturation. Addressing this should be your top priority.
Net new reach is a custom KPI that I covered in “6 advanced (yet missing) Meta Ads KPIs to track success.”
Increased negative feedback
Quantitative KPIs are important, but qualitative feedback – such as sales calls or social media comments – can provide more nuanced insights.
Focus on aggressive messages and tones, though this feedback is more reactive and harder to automate, so track it as a third priority.
How to monitor audience saturation
Audience saturation is inherently negative, so it’s crucial to monitor it proactively.
Start by setting thresholds or alarms to adjust your campaigns before reaching this point.
Net new reach is a reliable KPI for establishing these thresholds or alarms.
However, in some cases, in-platform metrics can suffice. Be cautious, though as these metrics often provide a limited perspective.
Search and display impression share
Google defines impression share as:
“The percentage of impressions that your ads receive compared to the total number of impressions that your ads could get. Impression share = impressions / total eligible impressions.”
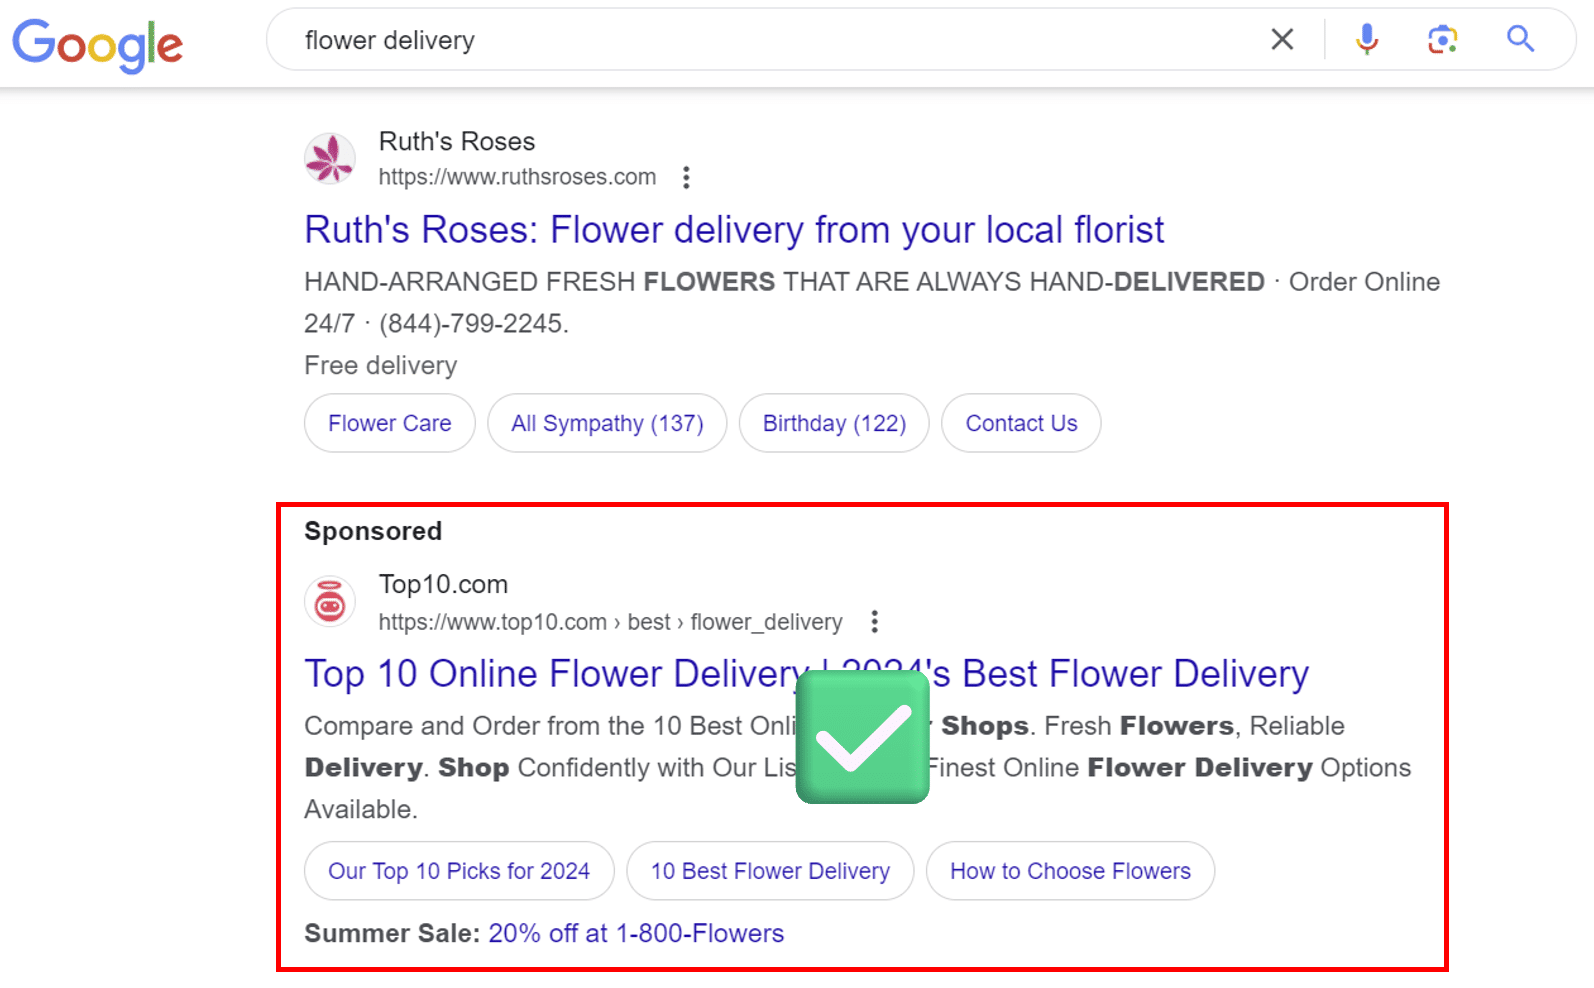
For example, if 100 people search for [flower delivery] on Google and your ad appears 90 times, you achieve a 90% impression share.
Does this indicate audience saturation?
Nearly so for this market or keyword.
However, your ads may still be effective, as search frequency tends to remain relatively low.
On the Display Network, the dynamics differ significantly.
For instance, in the example below, six ads were shown:
- 3 from Canva.
- 1 from Bitdefender.
- 1 from Iveco.
- 1 from Tikimob.fr.
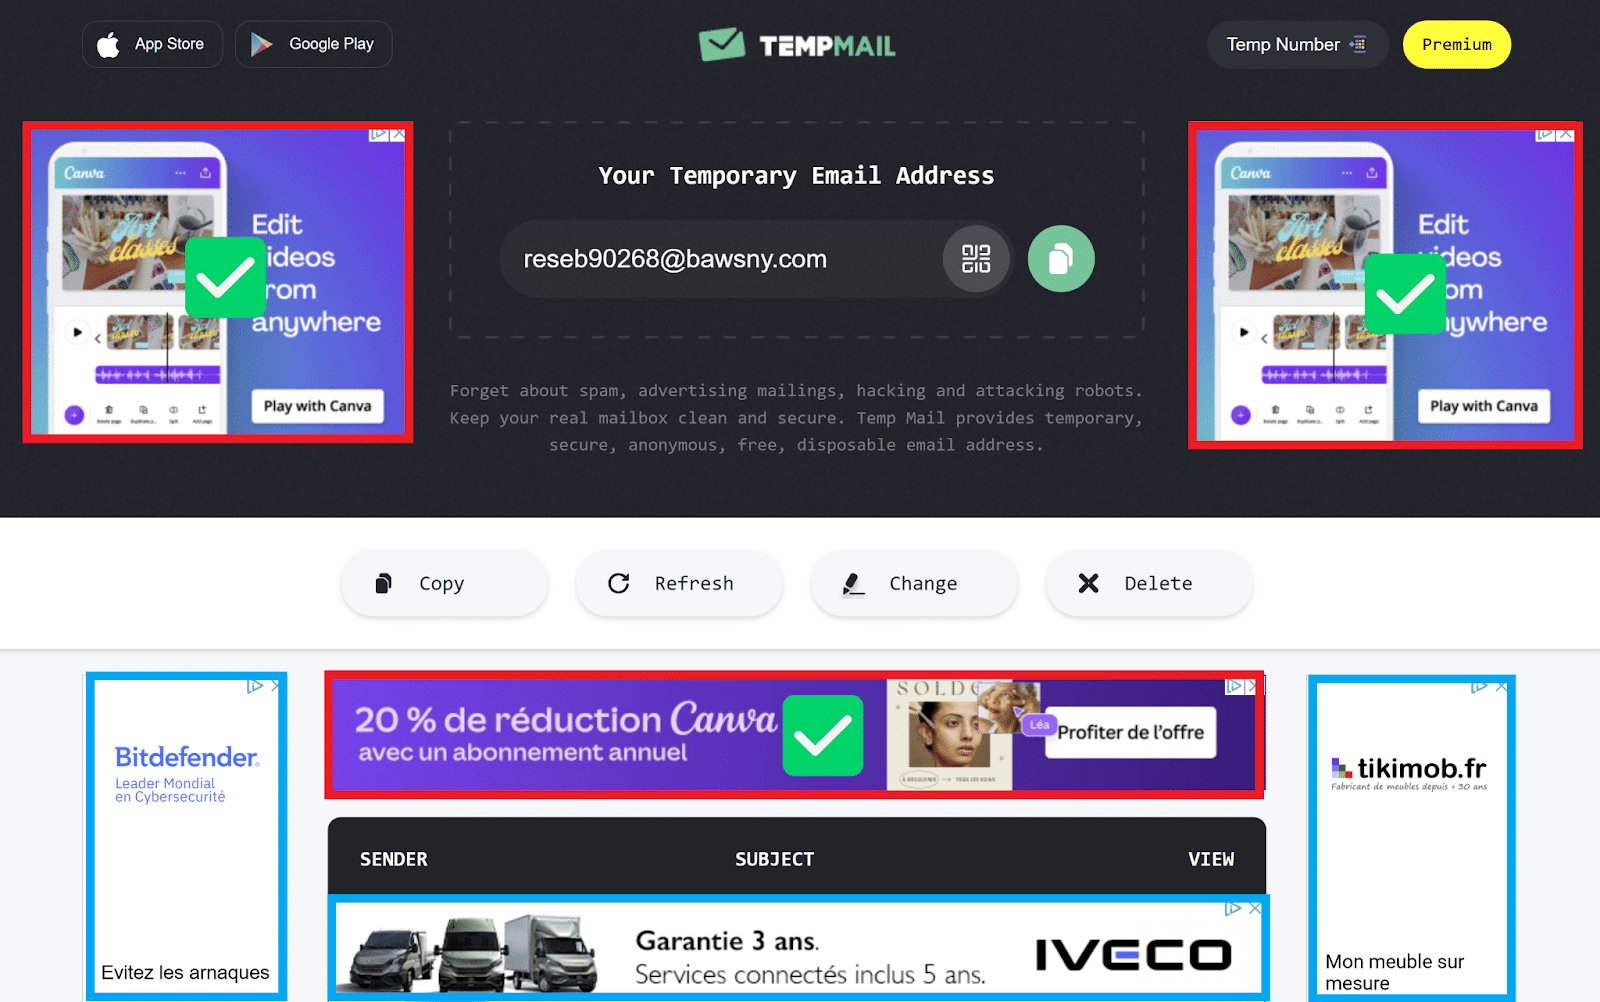
Here, Canva’s impression share is 50% (3 ads served out of 6 available slots). Is Canva’s audience saturated?
In this case, much more so than in the previous Search example.
The higher frequency on the Display Network intensifies the effect.
If this scenario persists for a month, a 50% Display Impression Share would almost certainly indicate that Canva is saturating its audience.
Frequency
Frequency measures the average number of times a unique user is shown your ad.
This metric is particularly insightful: if frequency is too high over a short period, it indicates audience saturation.
However, it has a significant limitation. It’s an average and doesn’t account for the time period.
For example, reaching a frequency of 7.1 has a very different impact depending on whether it spans a day, a week, or a month.

Cumulative frequency
This native Meta Ads metric is the total number of times a unique user was shown your ad.
This is the only native metric that reveals how audience saturation is trending. It answers a crucial question: “Are you reaching new users, or are you repeatedly serving ads to the same users?”
You can access cumulative frequency at the campaign, ad set, or ad level.
Simply hover over the entity name, click View charts, then customize the view by selecting Frequency (Cumulative).
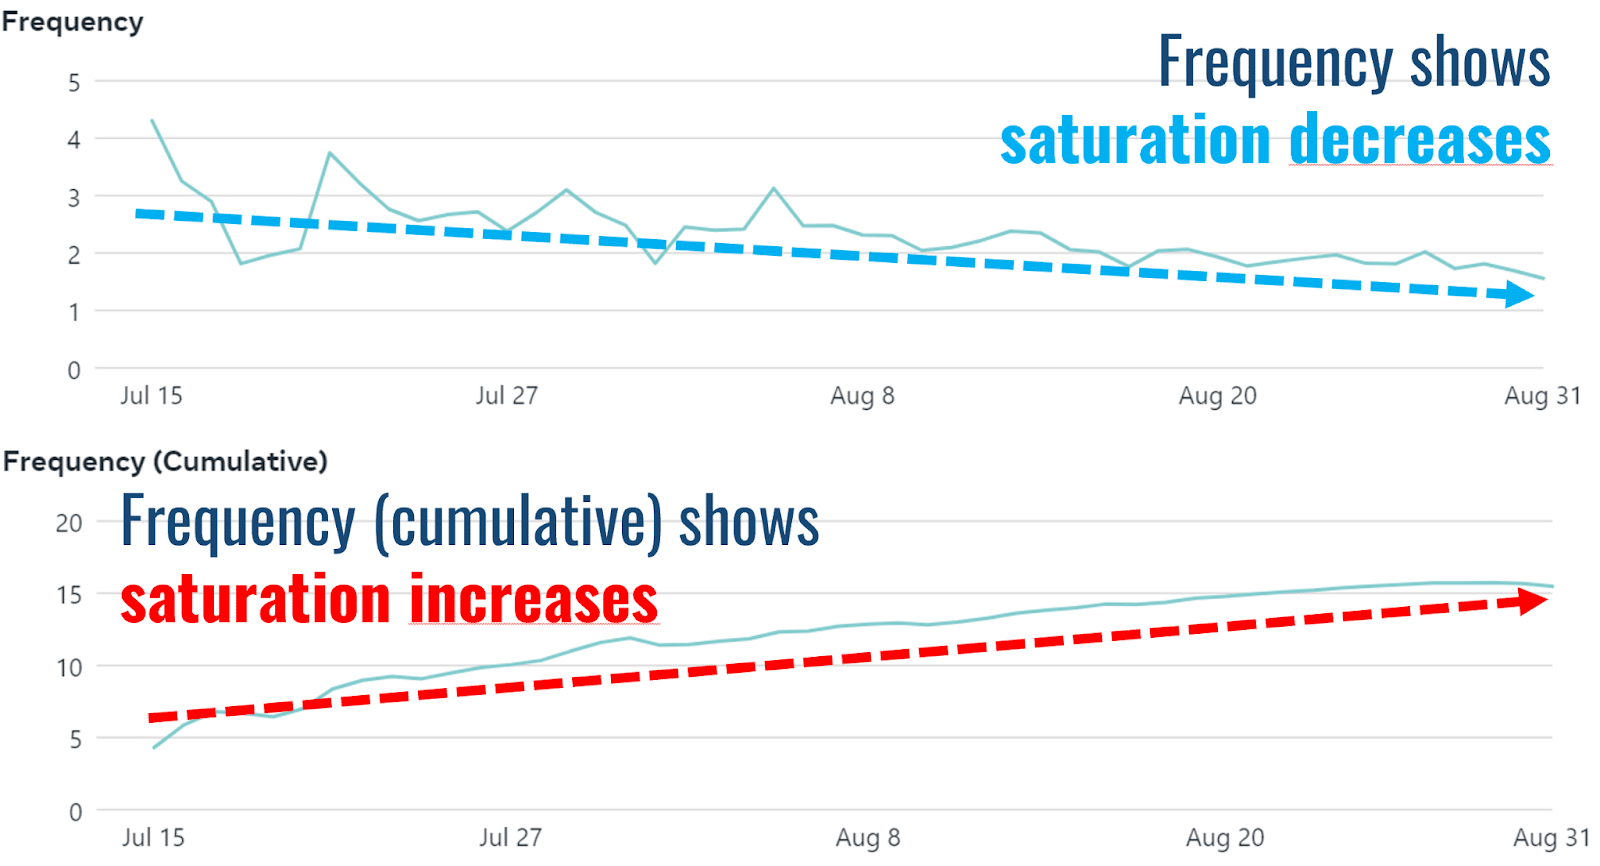
In the example below, relying solely on daily frequency might suggest you’re far from saturating your audience.
However, cumulative frequency can reveal a different story – showing that the same users are being exposed to your ads more frequently over time, which can be problematic.
After six weeks, if a user has seen your ads 15 times on average, this number might be acceptable or excessively high depending on your industry, product, and sales cycle.
Cumulative frequency has several drawbacks:
- It’s only available in Meta Ads.
- It’s not available at the account level.
To monitor audience saturation more effectively, it’s better to use net new reach.
5 solutions to overcome audience saturation
If you’re already in audience saturation territory, here are a bunch of solutions to course correct:
1. Isolate finite audiences
Avoid combining finite audiences (e.g., branded search or retargeting) with broader, colder audiences (e.g., non-branded search and non-retargeting audiences).
Finite audiences are much smaller and highly susceptible to saturation. Isolating them allows for better monitoring and budget adjustments.
Without visibility into these audiences, you cannot make the necessary adjustments. It’s that simple.
For instance, while Google recently introduced impression share for Performance Max campaigns, it does not adequately manage audience saturation.
This is because it doesn’t allow for isolating branded search and retargeting audiences, limiting its usefulness.
2. Review campaign goals
When setting up a campaign, selecting a conversion goal narrows your targetable audience to those the algorithm deems likely to complete that specific conversion.
While this approach can work well, it’s important to note that the algorithm relies solely on in-platform data. As a result, it may exclude qualified audiences simply because it lacks comprehensive information.
The takeaway: if your targeting is accurate and your creatives are strong, you will still reach qualified audiences.
These audiences may not generate as many in-platform conversions, but you should see an overall increase in macro-level purchases.
For example, in a retargeting audience targeting pre-qualified users, is it necessary to choose a purchase conversion goal? A reach objective might be more appropriate in such cases.
3. Expand to new audiences
If you’re saturating your existing audience pool, the logical next step is to expand beyond it. This can involve exploring new:
- Geos (i.e., adding Ireland to your UK campaign).
- Ad networks (i.e., using Microsoft Ads alongside Google Ads).
- Channels (i.e., adding shopping campaigns on top of search campaigns).
- Placements (i.e., adding Messenger on top of Facebook and Instagram).
- Audiences (i.e., widening your Lookalike audiences).
Expanding to new channels or audiences is a challenging process. It requires time, resources, and expertise. However, it’s a worthwhile effort to combat audience saturation effectively.
For example, my agency often starts with LinkedIn Ads and Google Ads search campaigns for B2B clients.
However, we frequently find that the limited volumes on these platforms hinder campaign scalability.
A viable strategy for expanding B2B target audiences is leveraging other ad networks like Meta Ads.
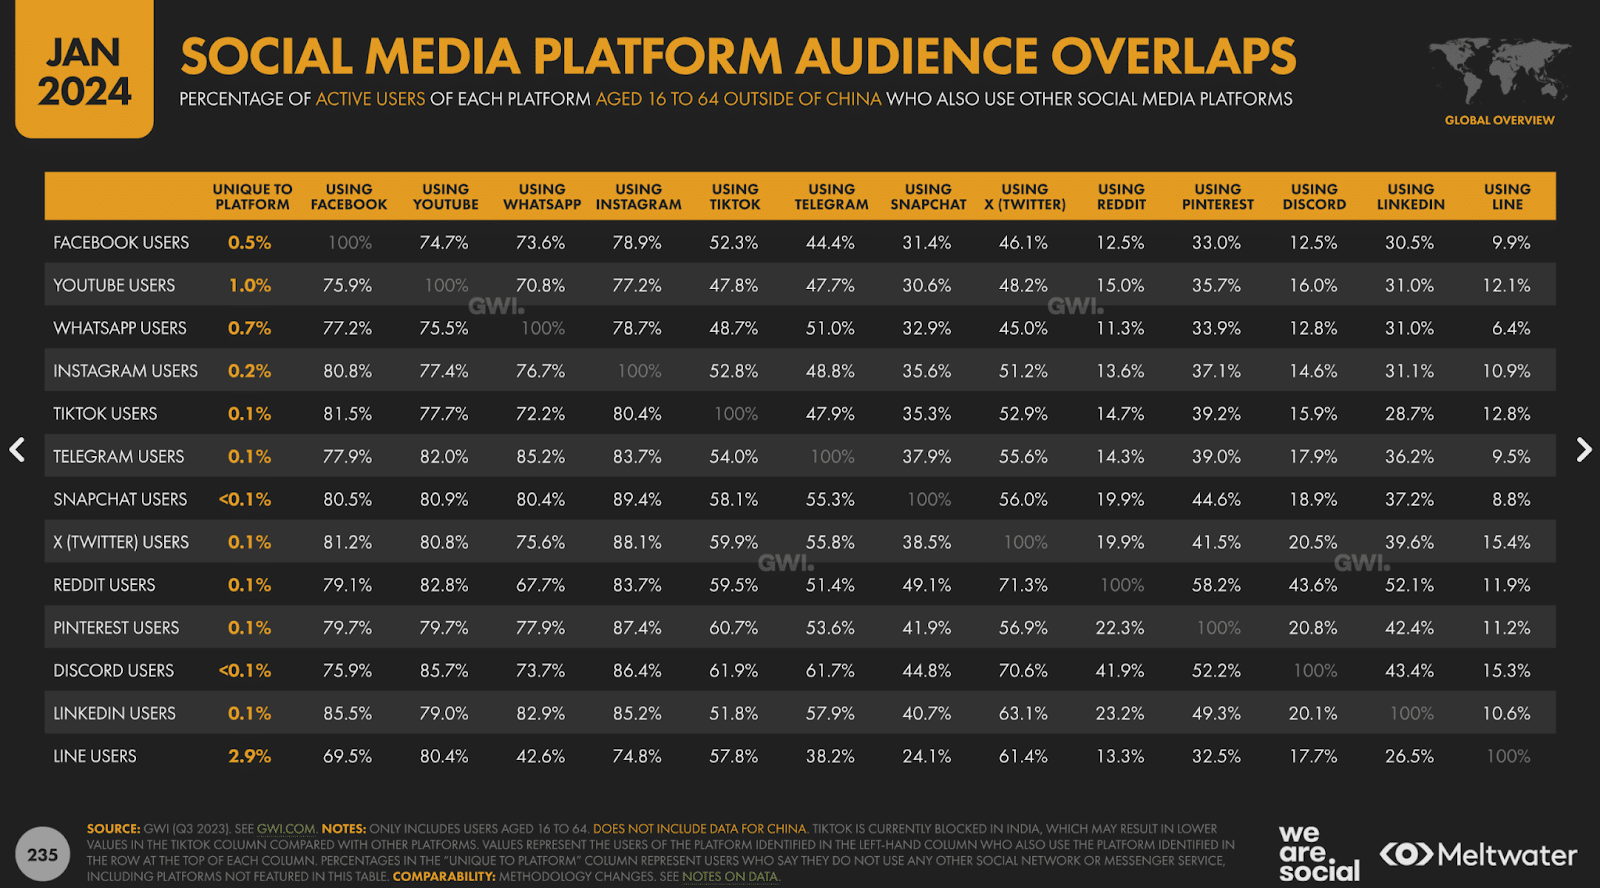
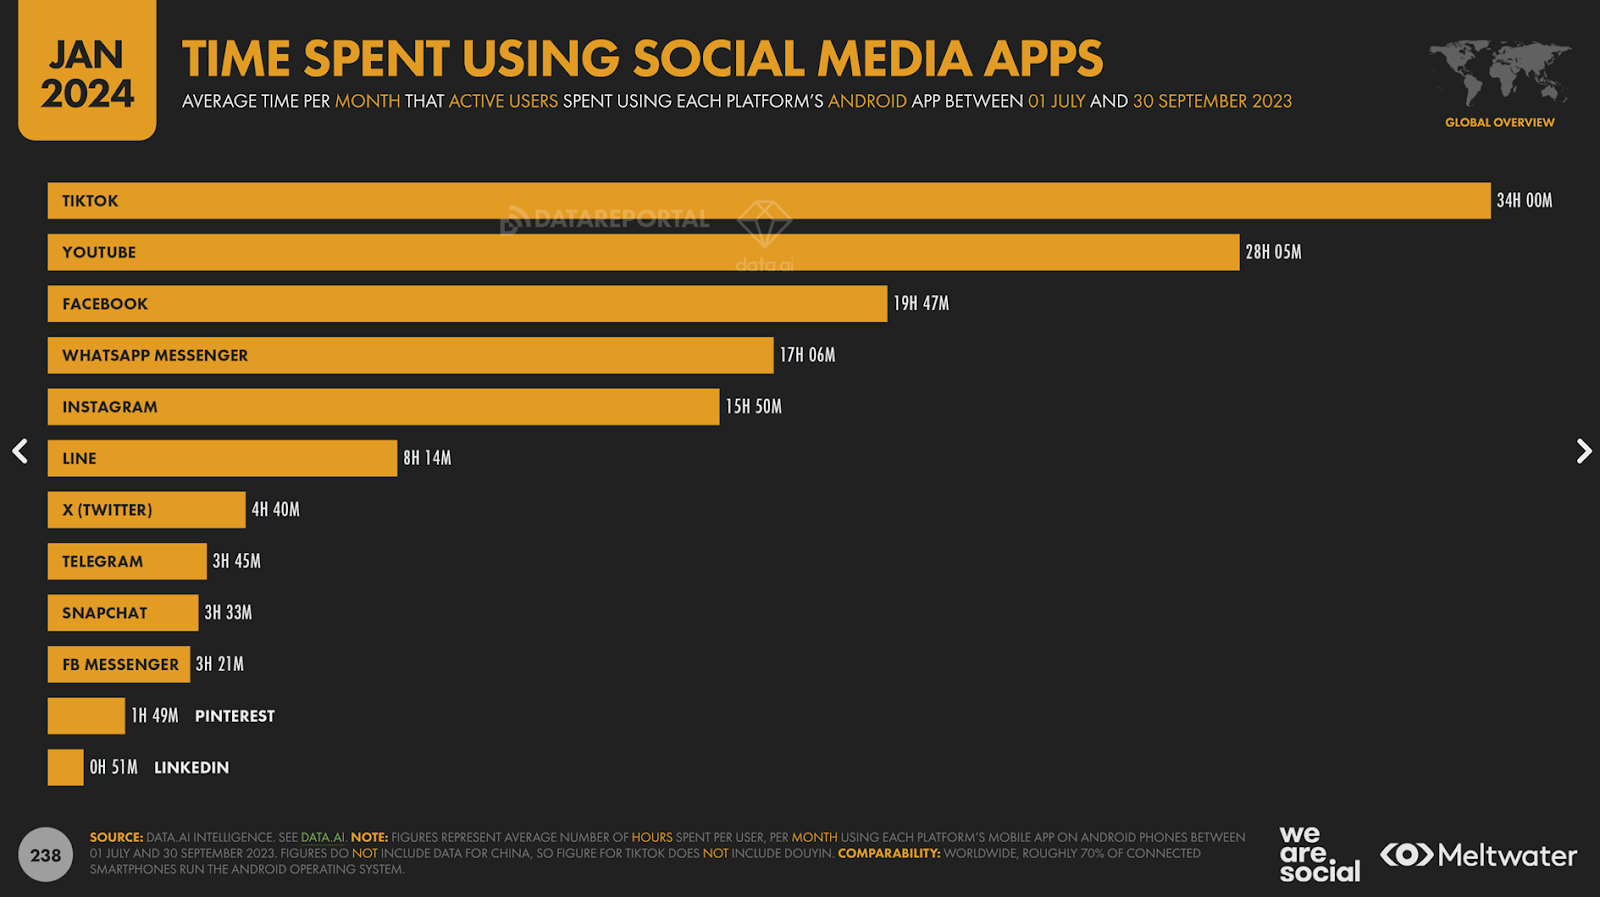
User-level data reveals that 85.5% of LinkedIn users also use Facebook, while 85.2% use Instagram.
Additionally, users spend 35 times more time on Facebook and Instagram combined than on LinkedIn, creating significantly more opportunities to reach the same audience at a lower cost.
4. Decrease budget
When the market is fully saturated, reducing budgets can improve efficiency.
While this scenario doesn’t occur often, recognizing it when it does is crucial.
This is the time to focus on doing more with less. Reducing spend may not drive growth, but it increases efficiency.
After all, ROAS is revenue divided by cost.
Achieving the same revenue at a lower cost isn’t exactly growth, but it’s a win for efficiency. Your CFO will thank you for it.
5. Refresh and sequence ads
In some cases, it’s essential to keep your audience engaged over a long period.
To do so, avoid showing the same ad repeatedly to the same audience.
Repetition can lead to fatigue, but rotating ads with varied messages or formats can help re-engage your audience.
There’s no such thing as the “perfect” hook or message, so it’s critical to offer fresh perspectives on your product or service.
For example, you could show a lifestyle video ad, followed by a feature-focused carousel ad, a social proof image ad, an educational piece, and even a founder story.
Sequencing ads in this way keeps your messaging dynamic and engaging.
Real-life case studies
Now I know that some of the above solutions can be tough to implement due to stakeholders’ buy-in. So here are some of my agency’s own case studies to help you move the needle:
B2B software
Overview
- Ad networks: Meta and LinkedIn Ads.
- Campaign types: Lead generation.
- Goal: SQLs (sales-qualified leads).
Challenge
The long sales cycle and low conversion volume typical of B2B campaigns created resistance.
Stakeholders were hesitant, saying, “If you mess this up, we won’t see results for six months—and we’ll have lost six months! Let’s stick to what we’ve always done.”
At the time, this meant relying exclusively on 1% Lookalike audiences (in 2022).
Solution
We first ensured:
- Only a fraction of the total addressable market had been reached.
- Seed lists for Lookalike audiences were well-qualified.
- Campaign assets (ads, landing pages, content) were top-notch.
We then switched to Reach campaigns with frequency caps and gradually expanded to higher-percentage Lookalike audiences.
Recognizing that in-platform metrics wouldn’t fully capture results, we focused on CRM-level data for holistic measurement.
Results
- SQLs increased by up to 4x.
- Meta-attributed SQL share grew to 19%.
B2C education
Overview
- Ad network: Google Ads.
- Campaign types: Display and Video retargeting.
- Goal: Staying top of mind for 18 months.
Challenge
Negative feedback from prospects increased due to an oversaturated media mix (e.g., retargeting ads, emails, SMS campaigns, sales calls).
Solution
We collaborated with the owners of other marketing channels to organize a geo-split test.
Similar-performing regions were divided, and retargeting saturation levels were tested by adjusting budgets according to audience volume.
Success was evaluated based on holistic CAC and prospect feedback, as in-platform results weren’t reliable for such long sales cycles.
Results
- Retargeting budgets decreased by 27%.
- Sales increased by 6%.
- CAC decreased by 5%.
Key takeaways
Once your target audience is saturated, your campaigns lose impact and can even generate negative feedback.
To combat audience saturation:
- Diagnose: Regularly monitor KPIs such as Net New Reach, Cumulative Frequency, and Impression Share.
- Adapt: Adjust targeting, budgets, geographies, and creative strategies to keep audiences engaged.
By addressing saturation proactively, advertisers can turn plateaus into peaks, ensuring campaigns remain both impactful and cost-effective.
[Watch] From plateau to peak: Real-life case studies of beating audience saturation
If you missed my SMX presentation or want a deeper dive into these topics, check out my full presentation, followed by a Q&A session.
source https://searchengineland.com/how-to-beat-audience-saturation-in-ppc-kpis-methodology-and-case-studies-449358


0 Comments