Let’s face it: Turning raw data into actionable insights can be as cryptic as decoding ancient hieroglyphics, especially for the SEO rookies in your crew.
That’s the challenge I addressed in my SMX Advanced 2024 session.
Didn’t catch it? No worries. I’m recapping it all in this article series, one juicy nugget at a time. This is Part 2, so if you missed Part 1, check it out.
Get ready for a quick overview of key technical SEO metrics to track in Google Search Console. Compare your list with mine – you might spot something your SEO team has missed.
Senior SEO managers: This article is for your technical SEO newcomers. It explains how I would introduce Google Search Console metrics to bridge their knowledge gaps quickly.
Top tips for looking at Google Search Console metrics
- Don’t limit comparisons to just two data points: Avoid comparing just two points in time (end of last month vs. prior month). It’s like looking at two photos and missing the whole movie – especially the drama in the middle. This is a common mistake I see when upskilling SEOs to become advanced SEOs. You need to look at the ups and downs all month.
- Focus on one metric at a time: When looking at the stacked bar charts, look at each metric individually. Google likes to stack data in bar charts, often making fluctuations easier to overlook. This means you’ll turn off metrics to focus on each technical SEO metric one at a time.

- Save charts for later: Screenshot the charts and tuck them away for future reference. Google’s data only goes back a few months, but those images may be gold down the line.
- Record data regularly: Capture metrics in a spreadsheet that can be calculated in formulas. Choose a point in time, since getting daily data isn’t realistic unless you’re using the API. Consider a date at the end of each month. It’s not ideal, but it’s something that can be used in comparison charts to look for correlations.
- Check for more metrics: Many reports show just the top 10 metrics by default. Always check the bottom right of your screen. More insights might be hiding on page two. Don’t miss out.

- Investigate changes carefully: Every major shift calls for you to play detective. Pin down what date the metrics changed and determine if it’s something to investigate, correct, overlook or monitor closely. Chances are, you’ll need to loop in product management or the dev team for answers.
- Track tickets in each website release: Knowing what went live and when will be extremely helpful for correlating changes to fluctuations in Google Search Console data. Product managers and developers can’t be bothered explaining possible causes of every little blip in the data. Stay plugged into what dev is doing and when it’s going live. This means you should join the dev standups and read the release notes.
Let’s zero in on the essential technical SEO metrics in Google Search Console.
Page indexing
These reports are the bread and butter of every technical SEO. The Page indexing section of Google Search Console tells you if your content is making it to the SERPs.
But don’t just glance at the numbers. Dig deeper than the end of the month numbers. Look for fluctuations over time, not just a snapshot of one day at the end of the month.
Pages indexed
This one seems easy, right? If your indexed pages go down, you have fewer URLs ranking over time. That’s usually a problem.
- View this report in Google Search Console (located in the top chart, turn off pages not indexed)
Too many SEOs miss fluctuations in these Google Search Console charts by looking at the default view.
This causes the combination of non-indexed and indexed pages in the chart muddy the waters, causing you to miss what is happening. Instead, turn off Pages not indexed to look at indexed pages alone.

Pages not indexed
This count reveals how many URLs Google knows about but hasn’t indexed. Remember to toggle off Pages indexed for a clearer view of what actually happened over time.
- View this report in Google Search Console (located in the top chart, turn off pages indexed)
Why pages are not indexed
Here’s where the sleuthing kicks in because you can dive into why pages aren’t indexed. This section allows you to dig deeper and uncover why those pages aren’t getting indexed, along with a list of reasons and example URLs.
The most common culprits include:
- 404 errors.
- 5xx errors.
- Redirect errors.
- Noindex tags.
- Duplicate content.
I ignore plenty of the usual suspects – unless that fourth column trend line starts shifting.
For my clients, these metrics rarely budge. So I spend three seconds or less looking at the trend line. If things are trending well and there aren’t any fluctuations, then move on.

The metrics that only get three seconds or less reviewing for major trend line fluctuations:
- Crawled – currently not indexed.
- Discovered – currently not indexed.
- Blocked by robots.txt.
- Soft 404.
- Blocked due to other 4xx issue.
Note: Your Google Search Console might not show every possible reason for pages not being indexed because only the issues your site actually faces make it to your list of reasons why pages aren’t indexed. That said, most enterprise companies will see all (or nearly all) of the reasons above.
Videos indexed
This is where Google breaks down how many videos are indexed.
In the video mode update on Dec. 4, 2023, many videos were booted from the index for various reasons, which you will find in this section.
- Videos indexed: This tally reveals how many of your videos are in the Google index. Remember to isolate this metric in the chart – switch off Pages not indexed.
- Google Search Console Report (located in the top chart, turn off videos not indexed)
- Videos not indexed: This count shows how many videos didn’t make it into Google’s index. Remember to check this metric solo in the chart – turn off ‘Pages Not Indexed’.
- Google Search Console Report (located in the top chart, turn off videos not indexed)
Tip: If video indexing isn’t in your SEO roadmap, skip these metrics.
Why videos are not indexed
This is another place to figure out why Google has rejected your content (in this case, videos).
- View this report in Google Search Console (below the videos indexed chart)
Google makes it very clear what must be done to get your videos indexed, and many of the reasons are technical SEO action items.
The most common culprits include:
- Video is not in the main content of the page.
- Cannot determine video position and size.
- Thumbnail is missing or invalid.
- Unsupported thumbnail format.
- Invalid thumbnail size.
- Thumbnail blocked by robots.txt.
(View Google’s complete list of reasons.)
Tip: If video indexing isn’t in your SEO roadmap, you can breeze past these metrics. Unfortunately, many companies’ video SEO efforts have been sidelined by other priorities and if this is you, then you can probably skip this section until you’re ready to take action on video SEO.
Dig deeper: How to use Google Search Console to unlock easy SEO wins
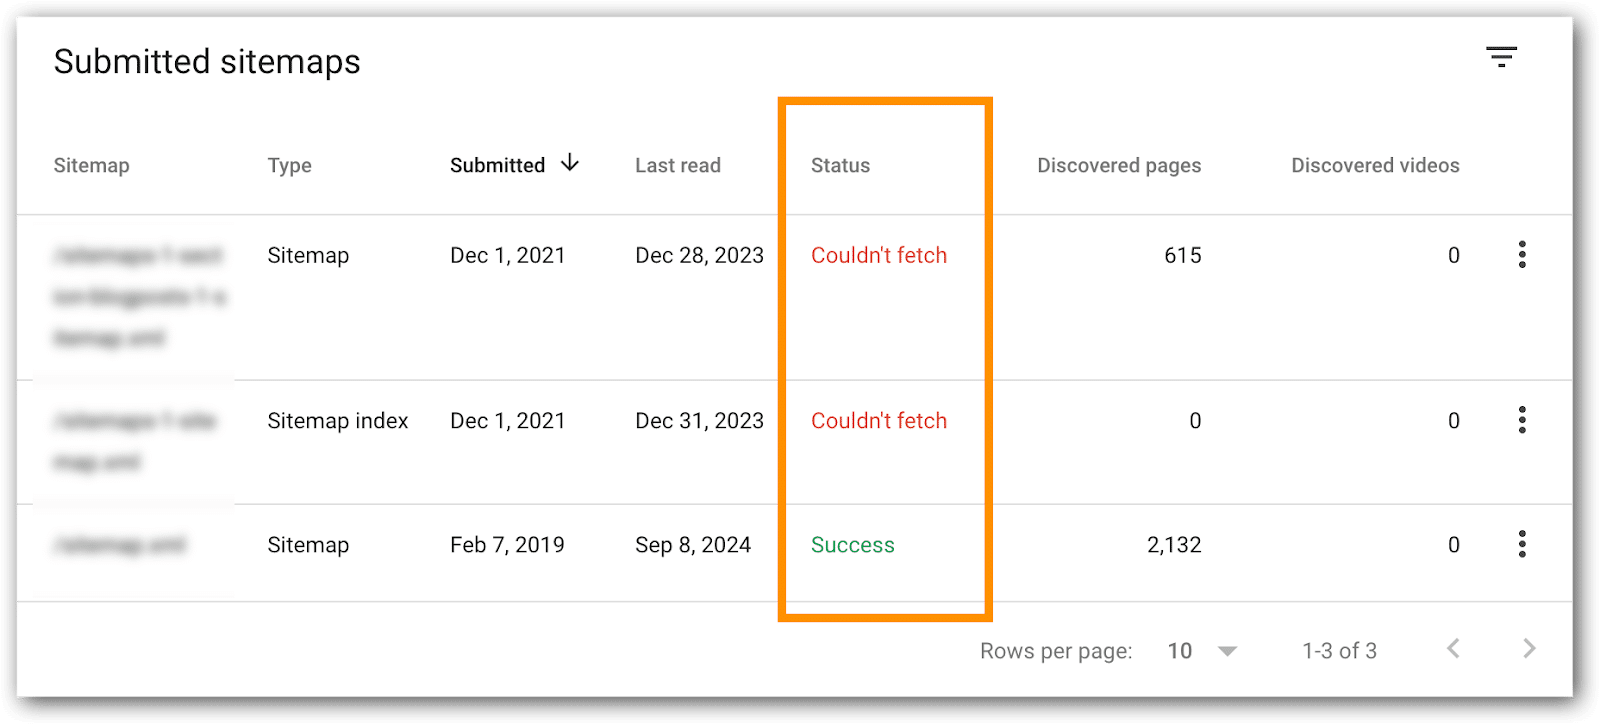
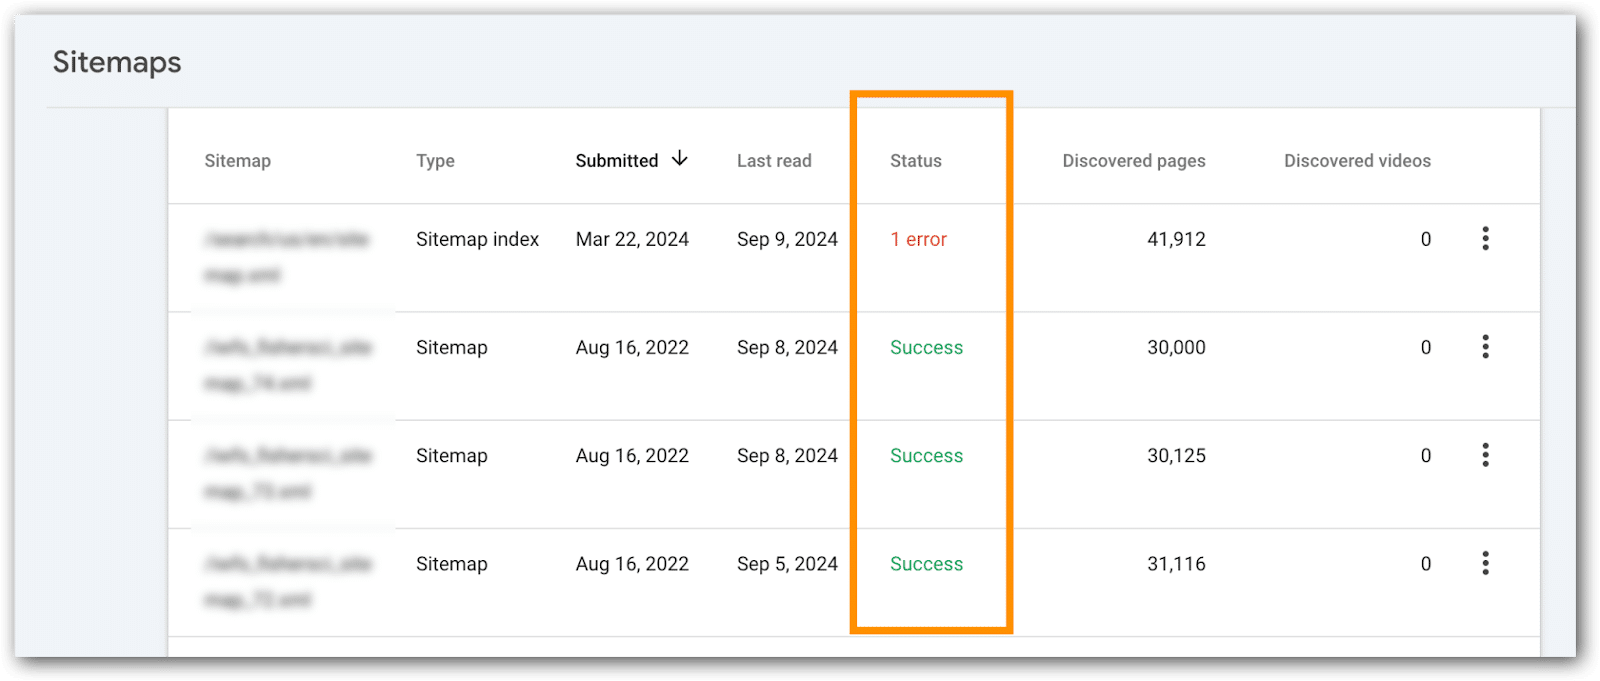
XML sitemap errors
XML sitemaps are search engine fuel, packed with crucial signals. For small sites, issues here typically don’t create problems.
Enterprise SEOs, watch these like a hawk – any glitches can prevent new URLs from being crawled, create hreflang tag confusion for search engines and prevent search engines from catching updates and crawling fresh content.
- Confirm each XML sitemap says “Success.”


- XML sitemaps that index high priority pages, confirm all URLs are indexed.
How to do this:
- Go go the XML sitemaps page.
- Click on the XML sitemap to examine.
- Page refreshes.
- Click on the “Page Indexing” or “Video Page Indexing” link.

- Page refreshes.
- You’ll see the URLs indexed from the XML sitemap you are examining.
Tips:
- For enterprise sites with hundreds of XML sitemaps, identify bellwether XML files to monitor – those replicated across countries, languages or divisions. Since they’re templated, you may be able to skip reviewing hundreds every month.
- If the number of indexed pages drops significantly, you can use these reports to help figure out which part of the site is not indexed. This becomes particularly useful if XML sitemaps are bokeh into URLs for a particular directory, country, template, category, business line, etc.
Mobile Core Web Vitals
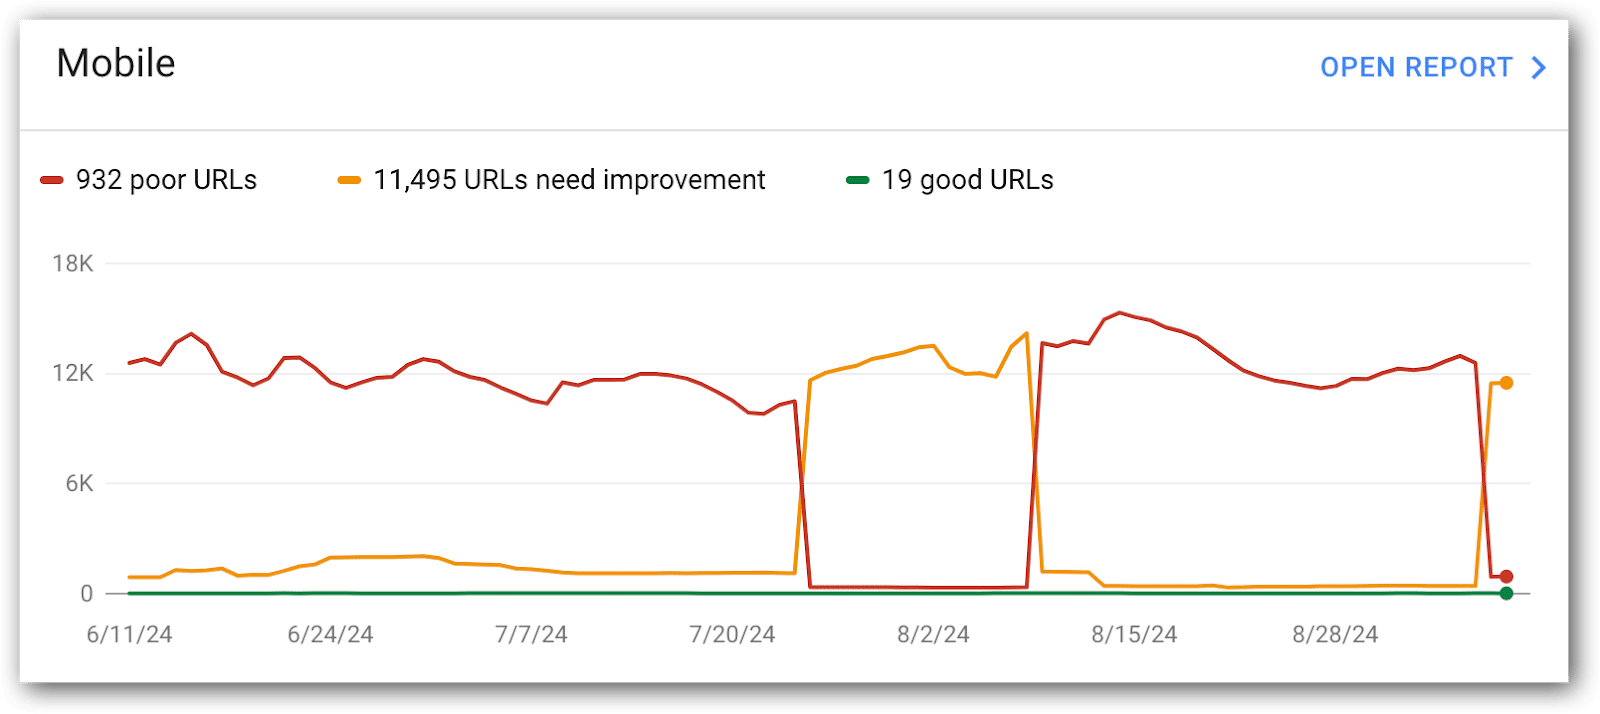
Mobile Core Web Vitals are the most important for SEO and deserve the most attention. Google also has much higher expectations for these URLs, so this is where you’ll focus most of your Core Web Vitals attention.
This is a report I like developers to see regularly, because you can see how URLs are flipping between the metrics and on which date. This can help you troubleshoot by coordinating these dates with changes on the site, CMS, DAM, network, etc.
Metrics to monitor:
- Mobile good URLs.
- Mobile poor URLs.
- Mobile needs improvement URLs.

The historical chart is great for quick trends, but it’s limited to a short window. For the bigger picture, drop the data into a spreadsheet and build your own chart.
You’ll often find that things look fine now, but 5 or 6 months ago, the metrics were far better – don’t let that slip past you.
Tip: This is a good report for development to see on a regular basis. Consider a regular metrics readout cadence with development to discuss what’s going on and compare it with what they know is happening in releases, server maintenance, third-party code and more.
Why mobile URLs don’t have a ‘good’ Core Web Vitals score
- View this report in Google Search Console (click on “open report” in the Mobile chart)
This data explains why particular URLs aren’t considered good by Google. Unfortunately, it doesn’t tell you how to address the problem (that requires you to do a Core Web Vitals audit).
In these metrics, you’ll get:
- The count of URLs scoring low in any of the core web vitals audit.
- A handy list of example URLs, thoughtfully grouped by Google based on similar issues. Unfortunately it’s not all URLs with similar issues, bit’s enough to help you spot patterns and identify areas for improvement.
Metrics to monitor in this report:
- LCP issue: longer than 2.5s (mobile)
- LCP issue: longer than 4s (mobile)
- CLS issue: more than 0.1 (mobile)
- CLS issue: more than 0.25 (mobile)
- INP issue: longer than 200ms (mobile)
- INP issue: longer than 500ms (mobile)
Developers usually need more than just metrics. They want the full list of URLs with low scores.
Luckily, Google gives you and your devs sample URLs to evaluate, though it’s not the comprehensive list they crave. To dig deeper for more URL examples, tap into the Google Search Console API for more data.
Tips:
- Include these in your regular metrics readout with development.
- The historical chart is handy for quick trends, but it’s got a short memory. For the full picture, toss the data into a spreadsheet and chart it yourself. Don’t let those historical highs and lows slip into the shadows. Even better if you grap the chart images because your spreadsheet likely won’t have metrics showing day-to-day fluctuations throughout each month.
Desktop Core Web Vitals metrics
This is exactly the same as mobile. Usually, I give this a quick gander, but most of the time is spent on mobile core web vitals metrics.
- View this report in Google Search Console (click on “open report” in the Desktop chart)
What is often interesting in the desktop metrics is correlations between metrics improving in desktop, but getting worse on mobile devices. This is a good place for development to figure out why mobile metrics got worse, but desktop improved.
Metrics to monitor:
- Desktop Good URLs.
- Desktop Poor URLs.
- Desktop Needs Improvement URLs.
Why Desktop Core Web Vitals metrics are low
- View this report in Google Search Console (click on “open report” in the Desktop chart)
Frankly, this is not a priority for the sites I work on. Not that I never look at them, but in the grand scheme of things we prioritize fixing mobile issues, anticipating that fixing mobile issues will fix desktop issues.
For a few of my B2B enterprise clients, with a primarily desktop-focused audience, we dial up the attention on these metrics to make sure nothing slips through the cracks:
- LCP issue: longer than 2.5s (desktop)
- LCP issue: longer than 2.5s (desktop)
- CLS issue: more than 0.25 (desktop)
- CLS issue: more than 0.1 (desktop)
- INP issue: longer than 200ms (desktop)
- INP issue: longer than 500ms (desktop)
Rich results from Schema
Adding Schema markup to your site unlocks special features that enhance your organic listings, such as breadcrumb links, product information and more.
In Google Search Console, URLs with code intended to trigger these SERP enhancements are tracked in a section called “Enhancements.”
The list of “Enhancements” listed in Google Search Console will vary based, on your site’s setup. Here are the most common enhancements you’ll likely see:
- Breadcrumbs.
- FAQ.
- Review Snippets.
- Videos.
- Unparsable Structured Data.
- Product Snippets.
- Merchant Listings.
- And more.
Each of these enhancements have a report indicating the number of URLs that are valid, invalid and issues to address.
What’s next?
Now that you have the key Google Search Console metrics, make sure you track them regularly (monthly works best).
Remember to drop these metrics into a spreadsheet. Google’s limited historical data might leave you hanging when you need those insights down the road.
In the next article of this series, I’ll show you a few metrics tucked away in the “settings” section of Google Search Console that few SEOs talk about, but I like to keep an eye on.
Dig deeper: 3 underutilized Google Search Console reports for diagnosing traffic drops
source https://searchengineland.com/google-search-console-metrics-monitor-monthly-446958

0 Comments